
By Krutie Patel · Published · Updated
Branching Tree Diagrams: How to Show Divergence and Convergence
Diagram Anatomy — Part 01
Some ideas move in a straight line while others branch into several possibilities. Imagine you're planning a new product. You have one idea, but several directions you could take it. Perhaps you could build a mobile app, a web application, or a browser extension. Each choice introduces new possibilities and decisions.
Now imagine the opposite situation. You're trying to understand why a product launch failed. You examine customer feedback, technical issues, marketing performance and support requests. Different sources of information contribute to one explanation.
These two situations involve different ways of thinking. The first moves from one idea towards many possibilities. The second moves from multiple inputs towards one conclusion. We can represent both using branching diagrams.
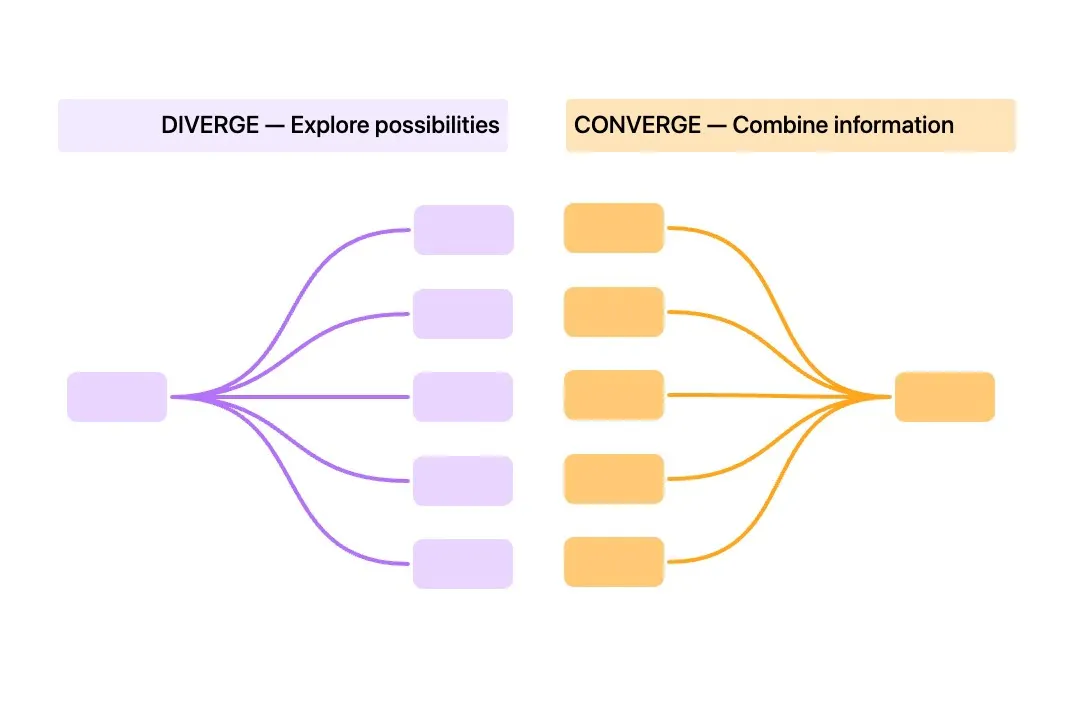
Interactive public template: Open the branching tree diagram in Diagrams.Design.
What is a branching tree diagram?
A branching tree diagram is a visual structure that starts with a central idea, question or root, then divides into smaller branches. It helps us break complex information into manageable parts and understand how those parts relate to one another.
Consider a simple question: How can we grow our business? You might begin with three possibilities: acquire new customers, retain existing customers or introduce new products. Each possibility can branch into more specific strategies.
Instead of presenting a long list of unrelated ideas, you create a structure that makes the relationships visible. A traditional tree has a root, branches and endpoints. When several independent paths merge into a shared destination, we're moving beyond a strict tree into a converging flow diagram. The two structures are worth studying together because they communicate complementary ways of organising information.
Branching out: Divergent thinking
One starting point. Many possibilities.
Divergence describes a movement away from a central point towards multiple alternatives. Alternatives can either be outcomes or consequences. We use it when we want to explore rather than narrow down.
Imagine asking a group of people how they would improve an existing product. One person suggests simplifying the interface. Another proposes introducing automation. Someone else recommends adding integrations. There may not be a single correct answer yet, but the purpose is to make the possibilities visible.

When should you use divergent branching?
Scenario planning: A single decision may lead to several possible outcomes.
For example, a company considering a new market might explore launching independently, finding a partner or acquiring an existing business. Each path could introduce another set of decisions.
Brainstorming and idea generation: Start with a subject and expand into related concepts, questions or opportunities. This is especially useful in early creative work, when identifying possibilities matters more than selecting the best one.
Risk and impact analysis: A single event may produce multiple consequences. Consider a major software outage. It could affect customer access, support demand, revenue, reputation and operational workload. A branching diagram helps communicate the potential consequences without burying them in paragraphs of text.
How to design a divergent diagram
Begin with the central question or idea. Place the related outcomes around it, leaving enough space for connectors and labels. Keep branches at the same level when they represent equivalent categories.
If one branch requires further explanation, extend it into another level rather than overcrowding the original diagram. Use consistent spacing, clear labels and enough visual contrast to distinguish the starting point from its outcomes.
And remember: more branches don't necessarily mean a better diagram. The goal is to reveal meaningful relationships, not every possible detail. Next, let's take a look at convergent thinking.
Branching in: Convergent thinking
Many inputs. One outcome.
Sometimes we need to work in the opposite direction. Rather than generating possibilities, we're bringing information together to understand a shared result.
Imagine investigating a website performance problem. You gather browser performance measurements, server logs, network timings, and user reports. These inputs contribute to an overall diagnosis. A converging diagram allows us to show the different pieces of evidence feeding into a single conclusion.

When should you use convergent branching?
Analysis and synthesis: Combine findings from multiple sources into one recommendation. This can be useful in research, consulting, product design and technical investigations.
Decision-making: Different considerations like cost, risk, feasibility, customer needs may inform a final decision. The diagram shows which inputs were considered, although it does not automatically explain how each input eventually contributes.
Process consolidation: Several independent workflows may eventually reach a shared step. For example, different customer support channels might feed into the same ticket management process.
How to design a convergent diagram
Start by identifying the final outcome. Then ask which independent inputs contribute to it. Arrange the inputs so the flow towards the outcome is easy to follow. Avoid crossing connectors unnecessarily. When the inputs are especially complex, group related factors before bringing them into the final node.
One important distinction: convergence does not necessarily mean that all inputs are equally important, or that each input causes the result. Use labels, visual emphasis or supporting explanation when those differences matter.
Divergence vs convergence: What's the difference?
Both structures organise relationships, but for different purposes.
It's tempting to think of divergence as creative thinking and convergence as analytical thinking. There's some usefulness in that distinction, however it isn't absolute. Creative work also requires selecting and refining ideas, while analytical work often begins by exploring multiple hypotheses. In practice, we regularly move between the two.
Diverge to discover possibilities. Converge to develop a conclusion.

Interactive public template: Explore the Creative problem-solving diagram in Diagrams.Design.
How animation changes the explanation
A static diagram shows where things connect, but an animated diagram can also show the order in which you want the audience to discover those connections.
For a divergent structure, you might reveal one branch at a time. The audience begins with a question, then considers each possible answer as it appears. And for a convergent structure, you might reveal independent inputs first, followed by their connections to the final result.
You can use three common approaches:
Sequential reveal: Introduce each branch individually when its meaning deserves attention.
Simultaneous reveal: Introduce related branches together when they represent parallel alternatives or equal contributors.
Directional reveal: Animate connectors outwards or inwards to emphasise how information moves through the structure.
Animation works best when it supports the explanation. And you may not need a dramatic transition for every branch. Sometimes a simple directional reveal is enough.
Create and animate a branching diagram in Diagrams.Design
You can use any diagramming software to create branching tree diagrams, however, Diagrams.Design is a sequence-based diagram animation software that is purpose-built for these type of structures where you connect your shapes and animate the relationships without manually constructing a motion-design timeline.
Here's a simple exercise.
- Start with a central idea. Create a shape and give it a meaningful label, such as "Product Idea".
- Add the branches. Place three or four related shapes around the central node.
- Connect the shapes. Use connectors to establish the relationships between the central idea and its branches.
- Choose the animation order. Reveal the central idea first, then animate the connecting paths and their destinations. Where appropriate, assign the same animation order to related elements so they appear together. Same number. Same moment.
- Preview the result. Check whether the direction and sequence make the explanation easier to follow.
- Export your diagram. Turn the animation into a video that can be used in presentations, tutorials or educational content.
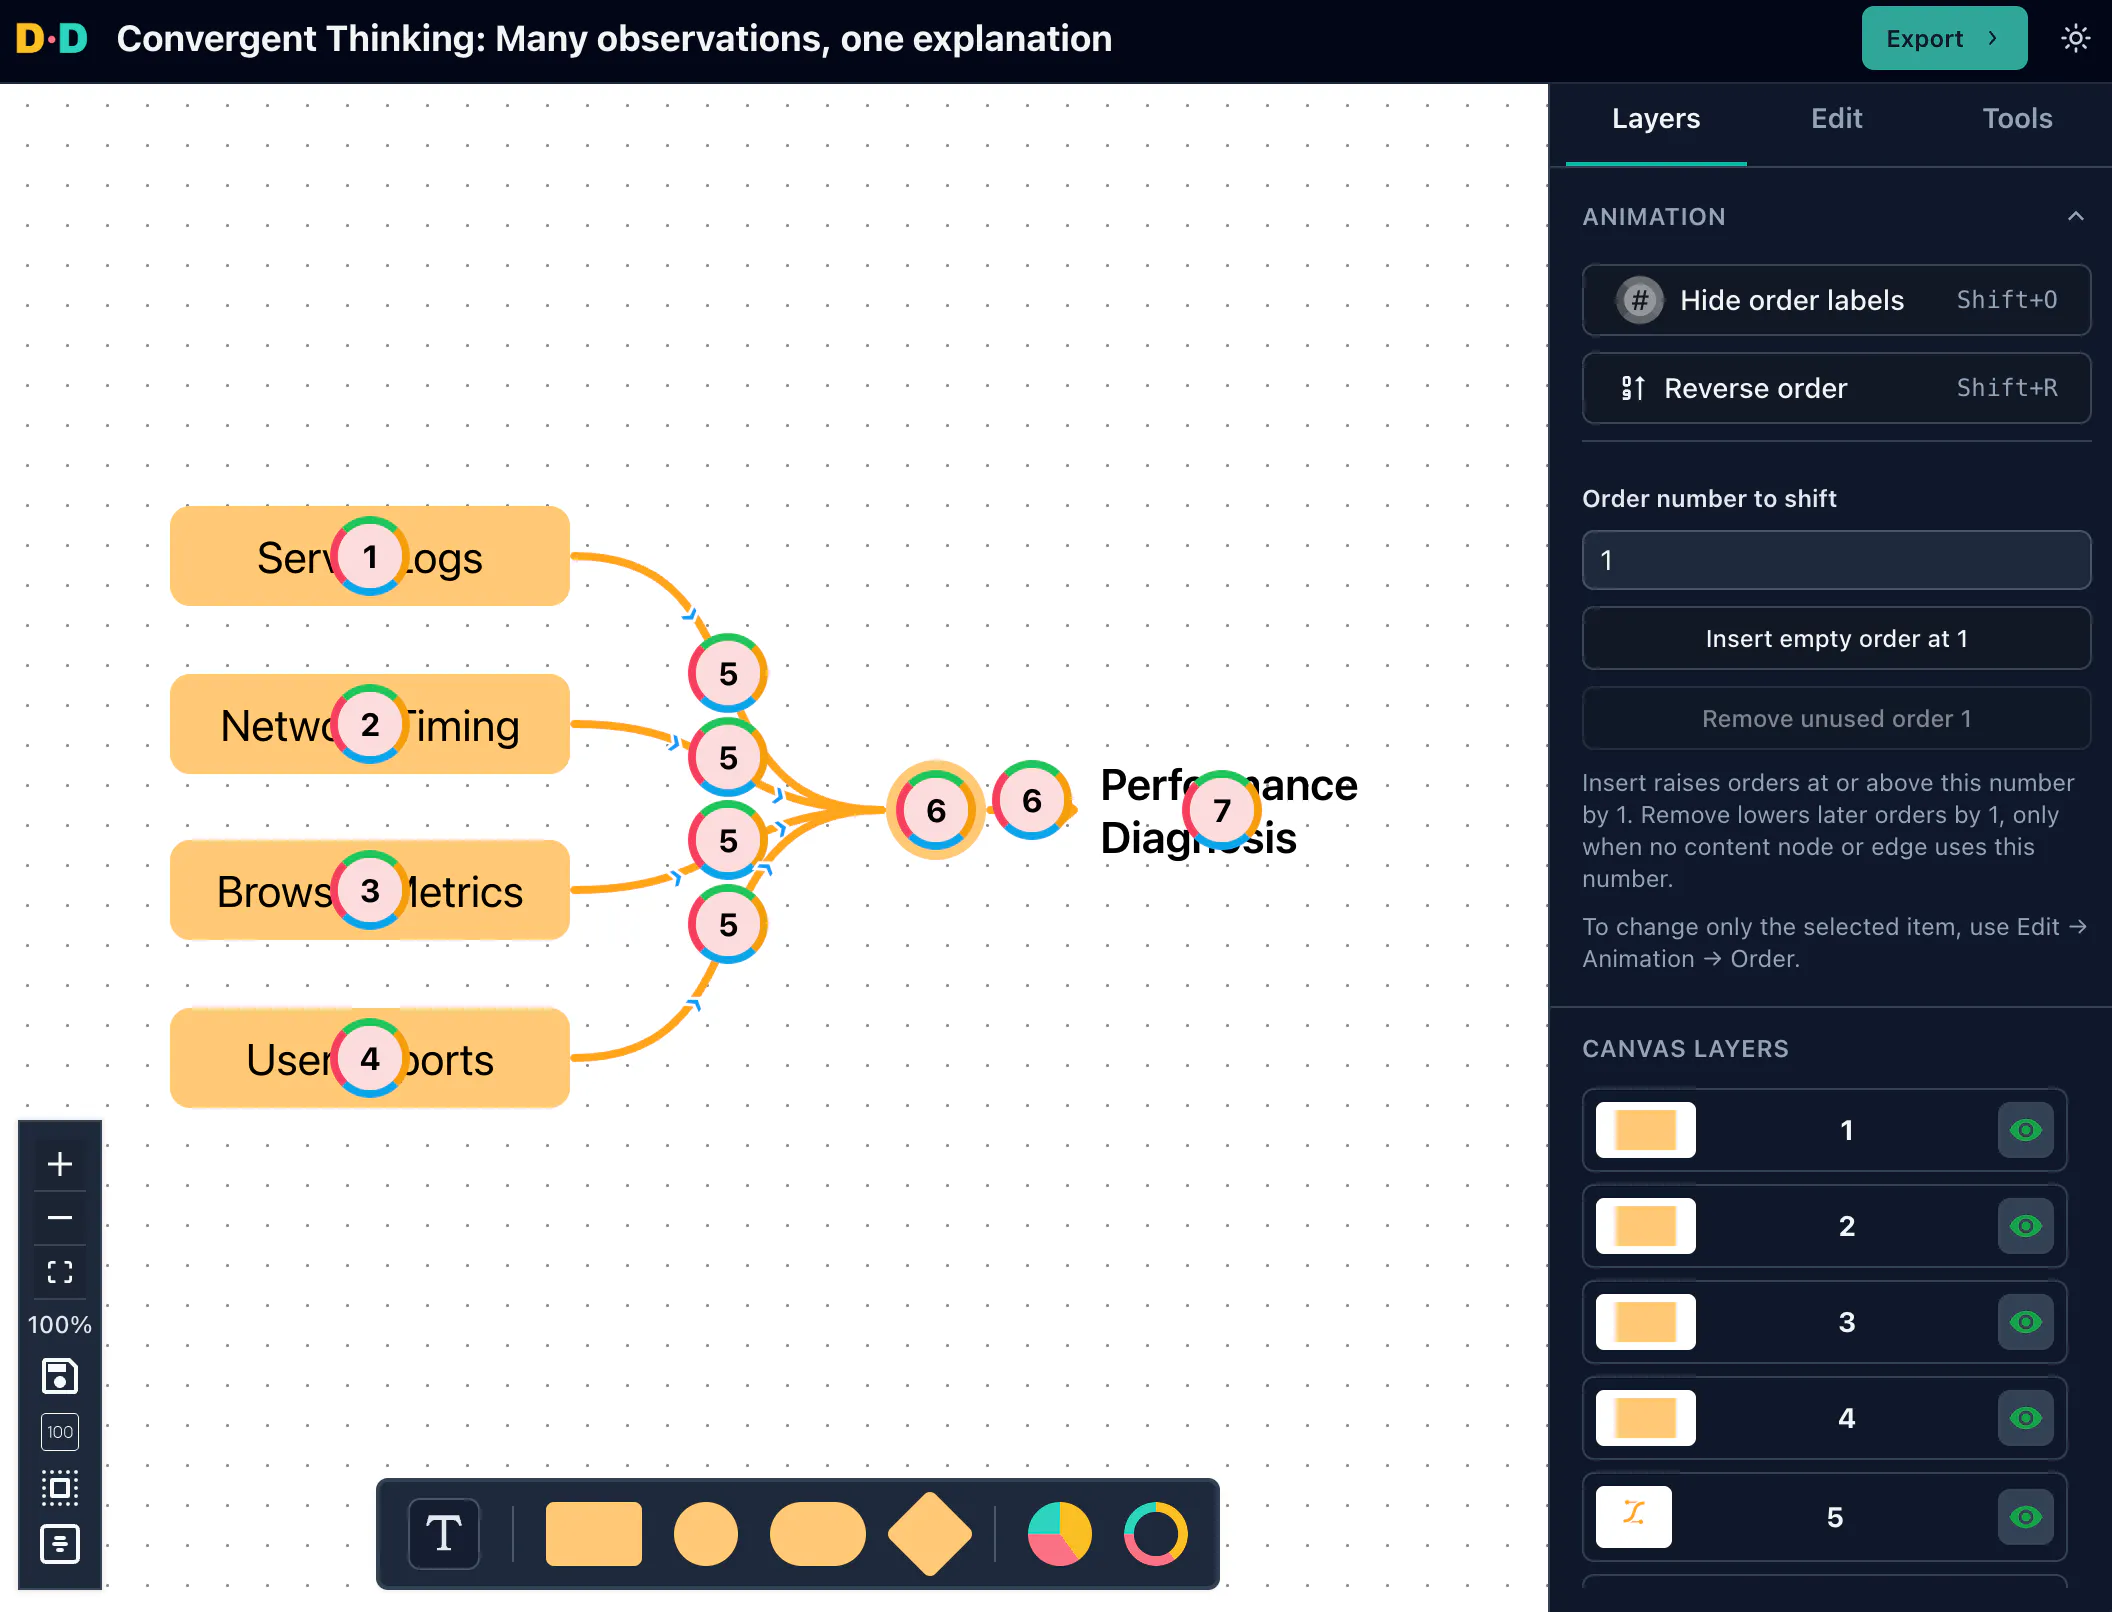
Interactive public template: Open and interact with the Convergent Thinking diagram in Diagrams.Design.
Common mistakes to avoid
Too many branches: When every possibility appears at once, the structure can become harder to understand, so consider grouping related branches or creating a second diagram for the details.
Unclear relationships: Lines should communicate meaningful connections. If two concepts are merely related, avoid presenting them as a cause-and-effect relationship without evidence.
Inconsistent visual hierarchy: Your starting point, intermediate branches and endpoints should be distinguishable. Scale, spacing and contrast can help communicate these levels.
Animation without purpose: Movement should help the audience follow the explanation. Unnecessary transitions can distract from the relationships you're trying to communicate.
Choosing the structure before understanding the idea: Don't force every subject into a branching tree. If you're explaining a sequence of steps, a linear flow might be more suitable. If you're showing a repeating process, consider a cycle. And if several paths repeatedly split and reconnect, you may need a flowchart or network rather than a tree.
Final thoughts
A good diagram doesn't merely organise information. It helps people understand why the information belongs together.
Branching diagrams are useful because they make two common forms of reasoning visible. Sometimes we need to explore possibilities. Sometimes we need to bring different ideas together. That's why knowing when to diverge and when to converge helps us choose a structure that matches what we're trying to explain. And when we introduce animation thoughtfully, we can guide the audience through that structure one relationship at a time.
Next in Diagram Anatomy: Linear Flow Diagrams: How to Explain Sequences, Dependencies and Progress.