
By Krutie Patel · Published · Updated
Linear Flow Diagrams: How to Explain Ideas One Step at a Time
Diagram Anatomy · 02 — Sequences, dependencies and progress
Most things are easier to understand when we know what comes next. Think about following a recipe, learning a new skill or understanding how a website loads in your browser. Each involves a series of events, actions or changes. Some must happen in a particular order. Others represent milestones along the way.
Explaining these processes in words alone can become tedious. We find ourselves saying "first", "then", "after that" and "finally", while hoping the reader can keep track. A linear flow diagram gives those words a visual structure.
It turns a sequence into a path, allowing us to see where something begins, how it progresses and where it ends. And although the idea is simple, linear flows can explain anything from a five-step tutorial to a complex technical system or even the journey of a fictional hero. Let's look at how they work, when to use them and how to design and animate them effectively.
What is a Linear Flow Diagram?
A linear flow diagram represents a sequence of steps, events or stages along a single, continuous path. Each stage leads to the next, guiding the viewer from a defined starting point towards an outcome. At its simplest, a linear flow looks like this:
A → B → C → D
The arrows establish direction. The stages establish order. Together, they answer one fundamental question:
What happens next?
Unlike branching diagrams, which show multiple possible outcomes, linear flows follow one progression at a time.
That doesn't mean the underlying process must be simple or that every event necessarily causes the next. A linear flow might represent chronological events, a series of instructions or a chain of dependencies.
It also doesn't have to follow a straight line. A sequence can move horizontally, vertically, around a circle or fold back across multiple rows. What makes it linear is the logic of the progression, not the physical shape of the path.
The Anatomy of a Linear Flow
Every effective linear flow has a few essential elements.
1. A starting point
The entry point tells us where to begin reading. This might be an initial event, a user action, an input or the first stage of a process.
2. Ordered stages
Each node represents a meaningful step. Ideally, a viewer should understand what happens at that stage from a short, descriptive label.
3. Directional connectors
Arrows communicate progression and help readers follow the intended order, particularly when the path changes direction.
4. Visual hierarchy
Spacing, colour, shape and typography distinguish major phases from individual steps. They help people understand not only what happens next, but how different stages belong together.
5. An outcome
The final stage gives the sequence a destination. It might represent a completed action, a transformed state or a milestone.
Together, these elements establish a visual reading order. When they work well, the viewer shouldn't need to guess where to look next.
Interactive public template: Interact with The Anatomy of a Linear Flow at diagrams.design
What Kind of Thinking Does a Linear Flow Represent?
A linear flow is a way of organising information through sequence, dependency and progress. These three ideas are closely related, but they aren't identical.
Sequence describes the order of events. For example, a company's history might show its founding, first product, expansion and eventual acquisition. These events occurred in a particular order, but one doesn't necessarily explain every other event.
Dependency describes something that must happen before another thing can proceed. Consider publishing a website. You generally need to prepare the code before building and deploying it. The sequence reflects practical requirements.
Progress describes movement towards a particular outcome. A learning journey might begin with basic concepts, progress through practical exercises and end with a completed project.
All three can be represented using the same visual structure, but they tell slightly different stories. This distinction matters because arrows can mean different things. An arrow might indicate "happens next", "depends on", "moves to" or "produces". A well-designed diagram makes that meaning clear through its labels and context.
When Should You Use a Linear Flow Diagram?
Linear flows are particularly effective when the order of information matters more than the relationships between unrelated parts. Here are five common applications.
Chronological timelines
Use a linear flow to show events unfolding over time, such as a product's evolution, a company's history or milestones in a project. The primary question is: What happened before and after this event?
Processes and workflows
Use one to describe the stages required to complete a task, such as reviewing a document, publishing an article or deploying an application. The primary question is: What needs to happen next?
Onboarding and tutorials
A linear flow can guide people through a series of instructions without presenting every detail at once. The primary question is: What should I do next?
Goal-oriented journeys
These diagrams work well when explaining progression towards a destination, for example, taking an idea from research to launch. The primary question is: How do we get from here to there?
Data and system pipelines
When information passes through a series of transformations, a linear flow can reveal the order of operations. The primary question is: How does the input become the output?
Of course, real processes aren't always strictly sequential. Some activities happen simultaneously, some repeat and others depend on decisions. A linear flow is most useful when those complexities aren't essential to the explanation or when we deliberately choose to focus on one particular path.
Linear Flows Don't Have to Be Straight Lines
Let's look at two examples that use very different visual arrangements to communicate a sequence.
Interactive public template: Open and interact with The Hero's Journey at diagrams.design
One of the most recognisable storytelling structures is the Hero's Journey. Popularised through the work of Joseph Campbell and adapted into a twelve-stage storytelling framework by Christopher Vogler, it describes a protagonist's progression through a transformative experience. And yes, I'm a movie buff who cares deeply about how stories are told in films.
The hero begins in an ordinary world, encounters a call to adventure, crosses into unfamiliar territory, faces challenges, experiences a transformation and eventually returns. The twelve stages are often presented in a circle, but a circular arrangement isn't necessary to explain the journey. In this diagram, I've used a serpentine layout, allowing the story to unfold across four rows, from the Ordinary World to Return with the Elixir.
The numbered stages establish the reading order, while three distinct colours separate the narrative into acts. Despite the changes in direction, the viewer follows one continuous path from beginning to end.
See how the journey concludes, the hero returns to a familiar world, but not necessarily as the same person who left it. The visual sequence reaches a definitive endpoint at Stage 12, just like how it happens in films.
This distinguishes the Hero's Journey from a conventional feedback loop. It's a single narrative progression that concludes with a return, rather than a process that continuously feeds its outcome back into its beginning.
The example illustrates an important principle of linear flow diagrams: a path can bend and reverse direction without losing its sequential logic. Its geometry can accommodate a complex narrative, while numbered stages and directional connectors preserve the order in which the story unfolds.
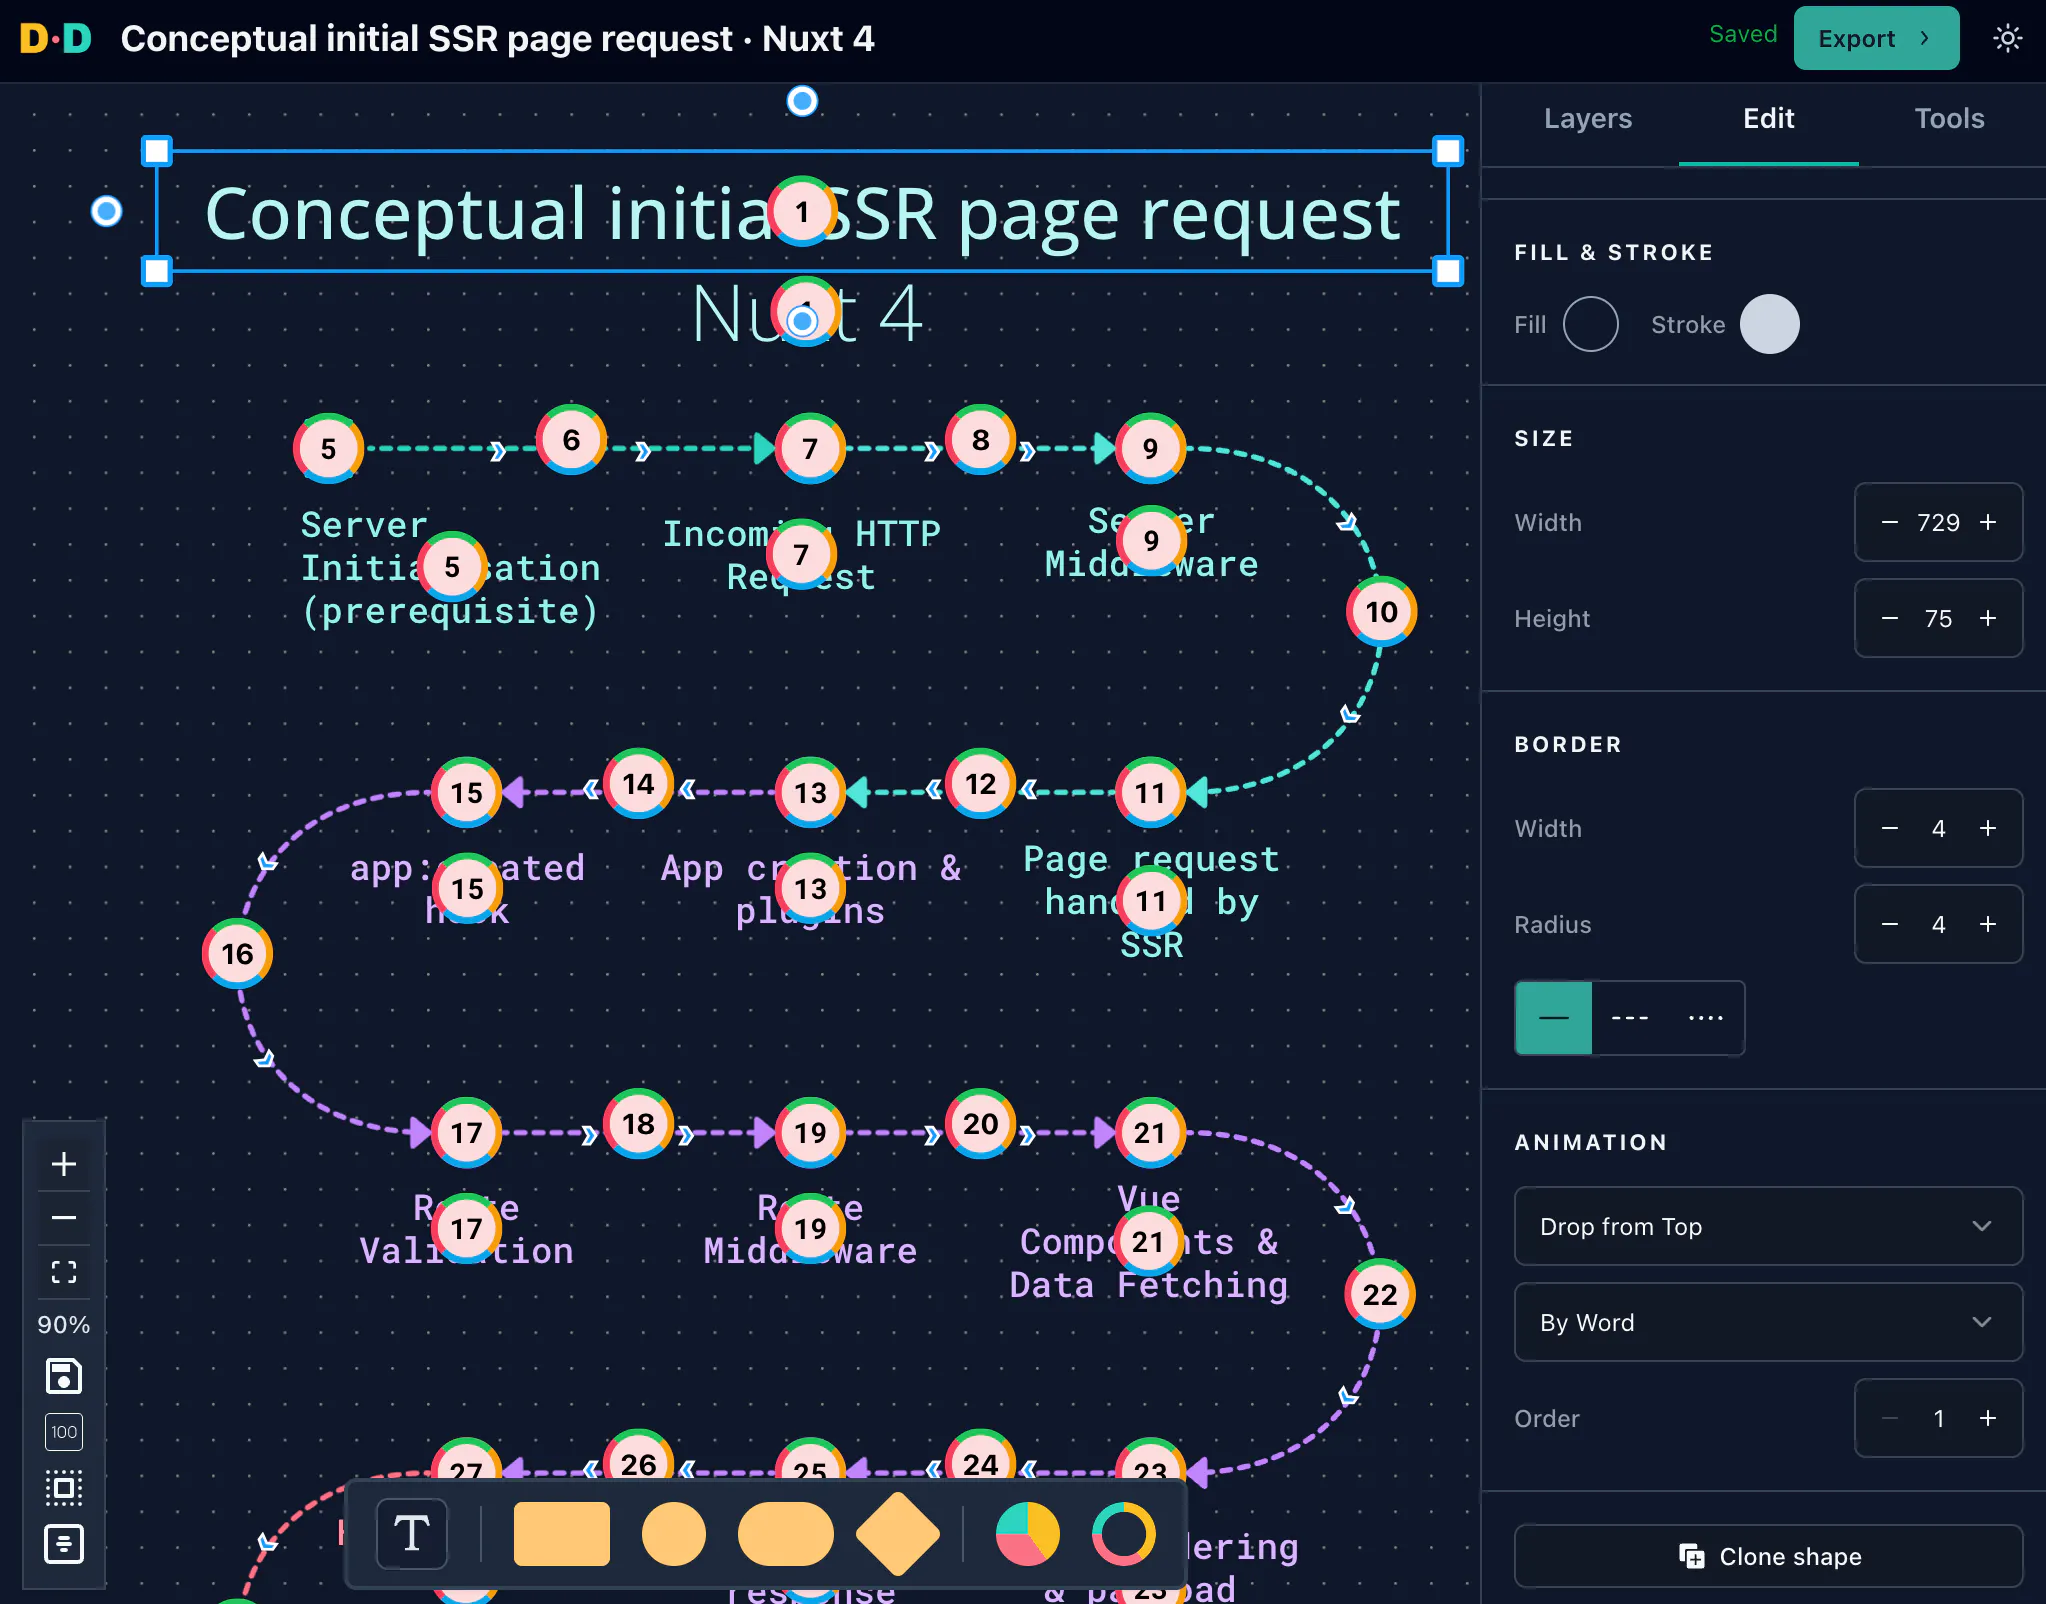
Interactive public template: Clone, interact and update The Lifecycle of an Initial SSR Request at diagrams.design and make it yours.
A web application involves many activities that aren't immediately visible to the person using it. In a server-rendered Nuxt application, an initial page request can involve server-side request processing, application setup, data fetching, HTML rendering and eventually hydration in the browser. These activities can be explained as a progression from the server to the client.
But fitting every stage into a single horizontal line would make the diagram impractically wide. Instead, the diagram uses a serpentine layout that has a zigzag flow. The sequence begins from left to right, curves downwards, returns in the opposite direction and continues across several rows.
Although the visual path changes direction, the underlying sequence remains continuous. Notice how the curved connectors perform an important job. They tell the viewer where one row finishes and the next begins. The colours also help separate conceptual phases, making a longer process easier to understand. This example demonstrates a valuable design principle:
You can change the geometry of a linear flow without changing its logic.
A technical note is worth making here: a simplified lifecycle diagram is a conceptual guide, not a complete execution trace. In Nuxt, plugins, middleware, rendering and data fetching can involve different execution environments and overlapping behaviour. A good educational diagram needs to be explicit about which path it represents.
How to Design a Clear Linear Flow Diagram
Before choosing shapes, colours or animation effects, work out what the diagram needs to explain. Here's a practical approach.
Step 1: Define the outcome
Start with one question: What should someone understand after seeing this diagram? If you're explaining a technical process, the goal might be to show how a request becomes a rendered page. For a tutorial, it might be to help someone complete a task. A clear outcome helps determine which stages belong in the diagram.
Step 2: Identify the major stages
Write down the steps in plain language before arranging anything visually. Don't worry about how they'll look yet. For example, publishing an article might involve:
Research → Outline → Draft → Edit → Publish
Five stages are enough to explain the overall process without overwhelming the viewer.
Step 3: Verify the order
Check whether the stages represent chronological order, dependencies or a conceptual progression. Ask whether any steps can occur simultaneously, whether a decision changes the path or whether the process repeats. If these differences matter, a simple linear flow might not be sufficient.
Step 4: Choose the layout
A horizontal layout works well for shorter sequences. Vertical layouts are useful for tutorials and mobile-first content. Serpentine layouts help accommodate longer processes, while circular arrangements can communicate a journey that returns to its origin. The best layout is the one that makes the reading order obvious.
Step 5: Establish visual hierarchy
Use consistent spacing and typography to create rhythm. Group related stages when appropriate and reserve colour changes for meaningful distinctions. If everything looks equally important, it becomes harder to recognise major transitions.
Step 6: Test the reading path
Look at the diagram without its accompanying explanation. Can you identify where it starts? Can you follow each connector? Is the final outcome apparent? If not, revisit the arrangement before adding more detail.
Step 7: Consider animation
Once the static diagram communicates clearly, ask whether movement could make the explanation easier to follow. Animation should reinforce the structure, not compensate for an unclear one.
How Animation Improves Linear Flow Diagrams
A static linear flow presents the entire sequence at once. That's useful when someone wants to scan the process, compare stages or return to a particular step. But sometimes, showing everything simultaneously creates unnecessary cognitive work.
The viewer has to decide where to begin, which elements matter and how the process unfolds. Animation provides another option: reveal information progressively. For linear flows, this is especially natural because the visual order already exists.
Reveal one stage at a time
Instead of displaying the complete diagram immediately, introduce the starting point first. Then reveal each successive stage. This guides attention through the explanation in the intended order.
Use connectors or movement to reveal the sequence
Connectors can appear progressively to guide the viewer from one stage to the next, making the direction and order of a sequence easier to follow. This is particularly useful in serpentine or zigzag arrangements, where the path may not be immediately obvious.
But connectors aren't always necessary. Animation itself can establish the reading order. Consider the circular arrangement below: when all seven circles appear simultaneously, there's no clear indication of where to begin or which direction to follow. Reveal them one at a time, clockwise and the sequence becomes apparent—even without a single connecting line.
Animate related elements together
Not every part of a process should appear separately. If several elements belong to the same logical stage, revealing them together can communicate their relationship more accurately.
Use colour to mark transitions
Colour can distinguish major phases, such as the acts of the Hero's Journey or the conceptual stages of a software system. Animation can make those phase transitions more apparent without introducing unnecessary effects.

Animating a Linear Flow with Diagrams.Design
Diagrams.Design is built around sequence-based animation. You can create your diagram, arrange its shapes and connectors and assign animation order to the elements you want to reveal. Elements sharing the same animation order can appear together, making it possible to communicate grouped stages without constructing a complicated motion timeline.
For a linear flow, you can work from the starting node to the final outcome, combining shape transitions with connector animations. You can then preview the progression and export your diagram as a video or animated GIF. For static diagrams, animated dashed connectors can also help suggest movement and direction, similar to those found in tools such as draw.io. The purpose isn't to turn every diagram into a motion graphic. It's to explain information in the order that makes the most sense.
When Not to Use a Linear Flow
Linear flows are powerful because they reduce complexity. But that simplicity also creates limitations. A linear diagram might imply that every event happens in sequence, even when some events occur simultaneously. It can also conceal alternative paths, recurring activities or relationships that aren't based on order.
- If a process includes multiple possible outcomes, a branching tree or decision flowchart may communicate it more accurately.
- If it repeats continuously, a cyclic or feedback-loop diagram might be more appropriate.
- If several activities happen in parallel, consider a parallel flow or swimlane diagram.
- And if the important question is how different parts connect rather than what happens next, a network or relationship diagram may be a better fit.
The point isn't to fit every explanation into a linear structure. It's to choose a structure that reflects the nature of the information.
Visual Thinking Practice: Can You Explain It in Five Steps?
Choose something you understand well. It could be a familiar workflow, a technical concept, a learning process or even the story of how an idea became a finished project. Try this exercise:
- Describe the outcome in one sentence.
- Identify five major stages.
- Arrange them in the order they occur.
- Connect them into a single, continuous path.
- Ask whether the result tells the truth about the process.
If it does, you've found a useful linear flow. If it doesn't, look more closely. Does the process branch? Does it repeat? Are important activities happening simultaneously? Sometimes, discovering that a linear flow doesn't work is just as valuable as successfully creating one. It means you've learned something about the information you're trying to explain.
Final Thoughts
A linear flow is more than a collection of shapes connected by arrows. It's a way of thinking about information through sequence. It helps us identify where something begins, understand how it progresses and recognise what happens next.
A well-designed linear flow makes that progression visible. An animated linear flow can go one step further, revealing the process one step at a time. Whether you're explaining a technical system, teaching a process or describing a fictional journey, the same principle applies:
Whether the path is straight, circular or serpentine, its geometry can change while the logic of the sequence remains intact.
Make the next step obvious.
Diagram Anatomy is a series from Diagrams.Design exploring how visual structures shape the way we explain ideas.
Next in the series: Cycles & Feedback Loops — Repetition, Reinforcement and Change.